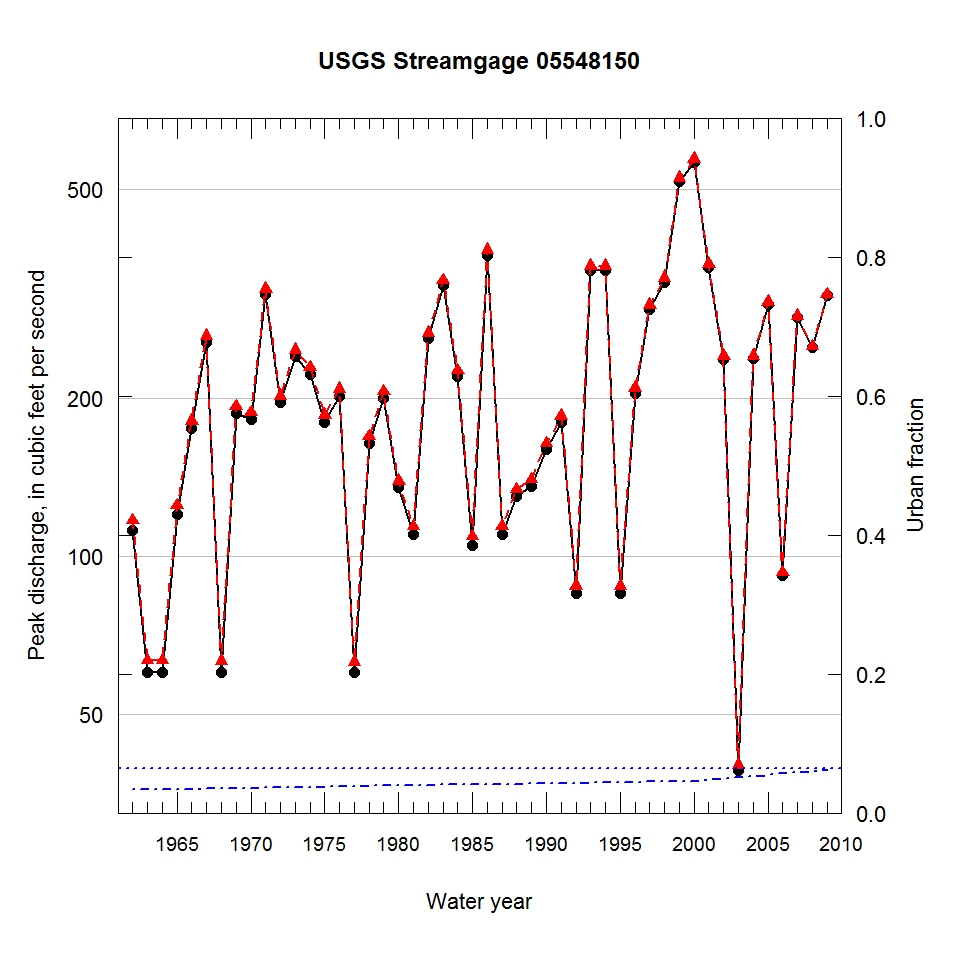
Observed and urbanization-adjusted annual maximum peak discharge and associated urban fraction and precipitation values at USGS streamgage:
05548150 NORTH BRANCH NIPPERSINK CREEK NEAR GENOA CITY, WI


| Water year | Segment | Discharge code | Cumulative reservoir storage (acre-feet) | Urban fraction | Precipitation (inches) | Observed peak discharge (ft3/s) | Adjusted peak discharge (ft3/s) | Exceedance probability |
| 1962 | 1 | -- | 0 | 0.034 | 0.003 | 112 | 117 | 0.821 |
| 1963 | 1 | 4B | 0 | 0.034 | 0.003 | 60 | 63 | 0.944 |
| 1964 | 1 | 4B | 0 | 0.034 | 0.003 | 60 | 63 | 0.944 |
| 1965 | 1 | -- | 0 | 0.034 | 0.093 | 120 | 125 | 0.797 |
| 1966 | 1 | -- | 0 | 0.035 | 0.502 | 175 | 181 | 0.612 |
| 1967 | 1 | -- | 0 | 0.035 | 0.840 | 255 | 263 | 0.349 |
| 1968 | 1 | 4B | 0 | 0.035 | 0.003 | 60 | 63 | 0.944 |
| 1969 | 1 | -- | 0 | 0.035 | 0.951 | 187 | 193 | 0.567 |
| 1970 | 1 | -- | 0 | 0.036 | 1.023 | 182 | 188 | 0.588 |
| 1971 | 1 | -- | 0 | 0.036 | 0.499 | 315 | 323 | 0.219 |
| 1972 | 1 | -- | 0 | 0.037 | 0.831 | 196 | 202 | 0.532 |
| 1973 | 1 | -- | 0 | 0.037 | 0.746 | 240 | 247 | 0.388 |
| 1974 | 1 | -- | 0 | 0.037 | 0.543 | 222 | 229 | 0.442 |
| 1975 | 1 | -- | 0 | 0.038 | 0.294 | 180 | 186 | 0.598 |
| 1976 | 1 | -- | 0 | 0.038 | 0.885 | 202 | 208 | 0.510 |
| 1977 | 1 | 4B | 0 | 0.039 | 0.003 | 60 | 63 | 0.945 |
| 1978 | 1 | -- | 0 | 0.039 | 1.312 | 164 | 169 | 0.651 |
| 1979 | 1 | -- | 0 | 0.039 | 1.208 | 200 | 206 | 0.519 |
| 1980 | 1 | -- | 0 | 0.040 | 0.631 | 135 | 139 | 0.754 |
| 1981 | 1 | -- | 0 | 0.040 | 0.759 | 110 | 114 | 0.830 |
| 1982 | 1 | -- | 0 | 0.040 | 0.324 | 260 | 266 | 0.340 |
| 1983 | 1 | -- | 0 | 0.041 | 1.447 | 328 | 335 | 0.198 |
| 1984 | 1 | -- | 0 | 0.041 | 1.130 | 220 | 226 | 0.451 |
| 1985 | 1 | -- | 0 | 0.041 | 0.512 | 105 | 109 | 0.844 |
| 1986 | 1 | -- | 0 | 0.041 | 0.176 | 375 | 383 | 0.144 |
| 1987 | 1 | -- | 0 | 0.042 | 0.822 | 110 | 114 | 0.831 |
| 1988 | 1 | -- | 0 | 0.042 | 0.598 | 130 | 134 | 0.769 |
| 1989 | 1 | -- | 0 | 0.042 | 1.842 | 136 | 140 | 0.752 |
| 1990 | 1 | -- | 0 | 0.042 | 0.532 | 160 | 164 | 0.667 |
| 1991 | 1 | -- | 0 | 0.043 | 0.927 | 180 | 185 | 0.602 |
| 1992 | 1 | -- | 0 | 0.043 | 0.640 | 85 | 88 | 0.898 |
| 1993 | 1 | -- | 0 | 0.043 | 1.270 | 350 | 357 | 0.173 |
| 1994 | 1 | 2 | 0 | 0.044 | 0.723 | 350 | 357 | 0.173 |
| 1995 | 1 | -- | 0 | 0.044 | 1.014 | 85 | 88 | 0.898 |
| 1996 | 1 | -- | 0 | 0.045 | 0.907 | 204 | 209 | 0.508 |
| 1997 | 1 | -- | 0 | 0.045 | 1.851 | 295 | 301 | 0.265 |
| 1998 | 1 | -- | 0 | 0.045 | 0.820 | 333 | 339 | 0.194 |
| 1999 | 1 | -- | 0 | 0.046 | 1.266 | 517 | 525 | 0.056 |
| 2000 | 1 | -- | 0 | 0.046 | 4.508 | 563 | 571 | 0.044 |
| 2001 | 1 | -- | 0 | 0.048 | 2.372 | 355 | 360 | 0.169 |
| 2002 | 1 | -- | 0 | 0.050 | 1.632 | 237 | 241 | 0.405 |
| 2003 | 1 | -- | 0 | 0.052 | 1.820 | 39 | 40 | 0.978 |
| 2004 | 1 | -- | 0 | 0.053 | 2.530 | 238 | 241 | 0.405 |
| 2005 | 1 | -- | 0 | 0.055 | 0.680 | 302 | 305 | 0.256 |
| 2006 | 1 | -- | 0 | 0.057 | 1.520 | 92 | 93 | 0.886 |
| 2007 | 1 | -- | 0 | 0.059 | 2.120 | 285 | 287 | 0.294 |
| 2008 | 1 | -- | 0 | 0.061 | 0.510 | 250 | 251 | 0.378 |
| 2009 | 1 | -- | 0 | 0.062 | 0.622 | 314 | 315 | 0.236 |

